UNDERSTANDING SUA CHANGES
Large urban areas and their populations are dynamic; they can grow, absorb nearby centres or decline. Consequently the Significant Urban Areas (SUAs) also change so that they continue to provide an effective statistical representation of these urban areas. Some examples of the way SUAs can change are described below.
Because SUAs represent larger Urban Centres their change is dominated by growth. In many cases this growth is contained within the Statistical Area Level 2 (SA2) boundaries that are used to define the SUAs. The SA2s are deliberately designed to include adjacent peri-urban settlement around towns and this means the urban population within both the SA2 and the SUA can grow to some degree without any changes to the boundaries needing to occur.
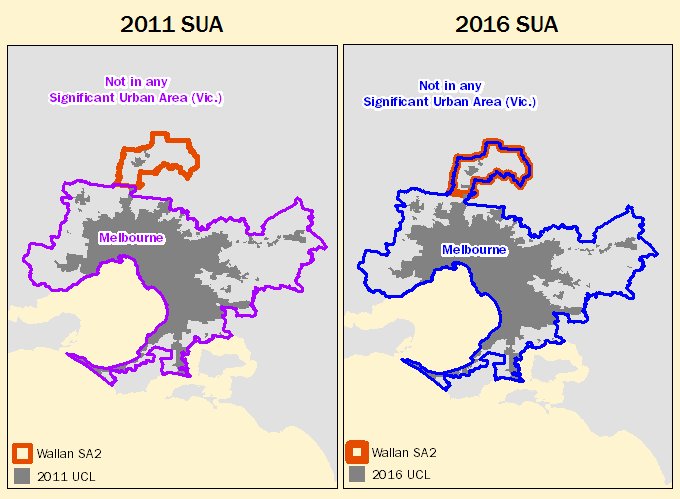
When small Urban Centres just outside an SUA grow to within 5 kilometres of the Urban Centre within the SUA, this causes the adjacent SA2 to be added to the SUA. This results in a change to the boundaries of the SUA as shown in the example below, where the Melbourne SUA has grown to include Wallan SA2 (Figure 3).
Figure 3. The SA2 of Wallan is added to the Melbourne SUA due to the urban growth around Wallan.
As the populations of Urban Centres grow to be 10,000 people or more new SUAs are created. This is one of the most common types of change in the SUA classification.
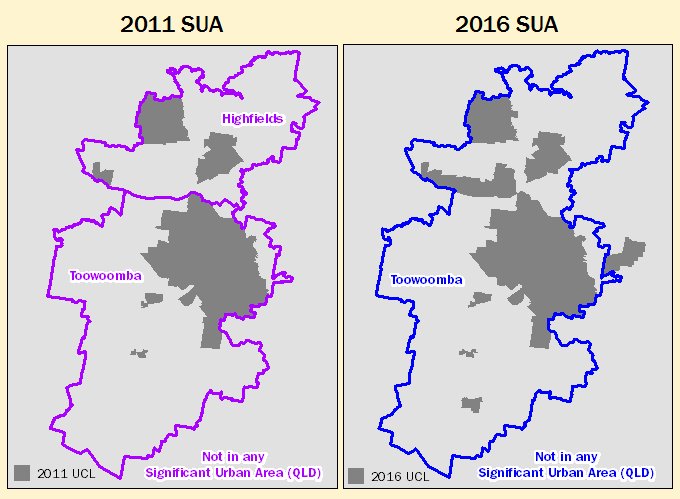
As the largest SUAs grow their urban settlement encroaches on other nearby or adjacent SUAs. When the Urban Centres that the SUAs represent are within 5 kilometres the SUAs are amalgamated into a single SUA. An example of this is shown in figure 4 below.
Figure 4. The SUAs of Toowoomba and Highfields are amalgamated into a single SUA in 2016.
These amalgamations of SUAs are typically how the boundaries of the larger SUAs change. Smaller changes to the SUA boundaries can result from changes to the SA2s that are used to represent the SUA.
This publication includes the ‘SUA_association_2011_2016.csv file’ which is located in the Downloads tab. This associates 2011 SUAs with an equivalent 2016 SUA to help users understand changes and make statistical comparisons between SUAs over multiple Censuses.
This table includes information on the area of the SUAs as well as the following types of changes:
- Amalgamated – When SUAs have been merged together to form one SUA.
- Name Change – When an SUA has changed name.
- New – When an SUA is new for 2016.
ABS Maps is an online mapping tool that allows users to visualise the boundaries and understand differences between different Australian Statistical Geography Standard (ASGS) boundaries, for example the 2011 and 2016 SUAs. This can be used in conjunction with the Association file to understand the SUA boundaries and any changes that have occurred.
 Print Page
 Print All